IMPORTANT LEVELS TO WATCH
July 13, 2011 : 11:03 am GMT
Daily Chart:

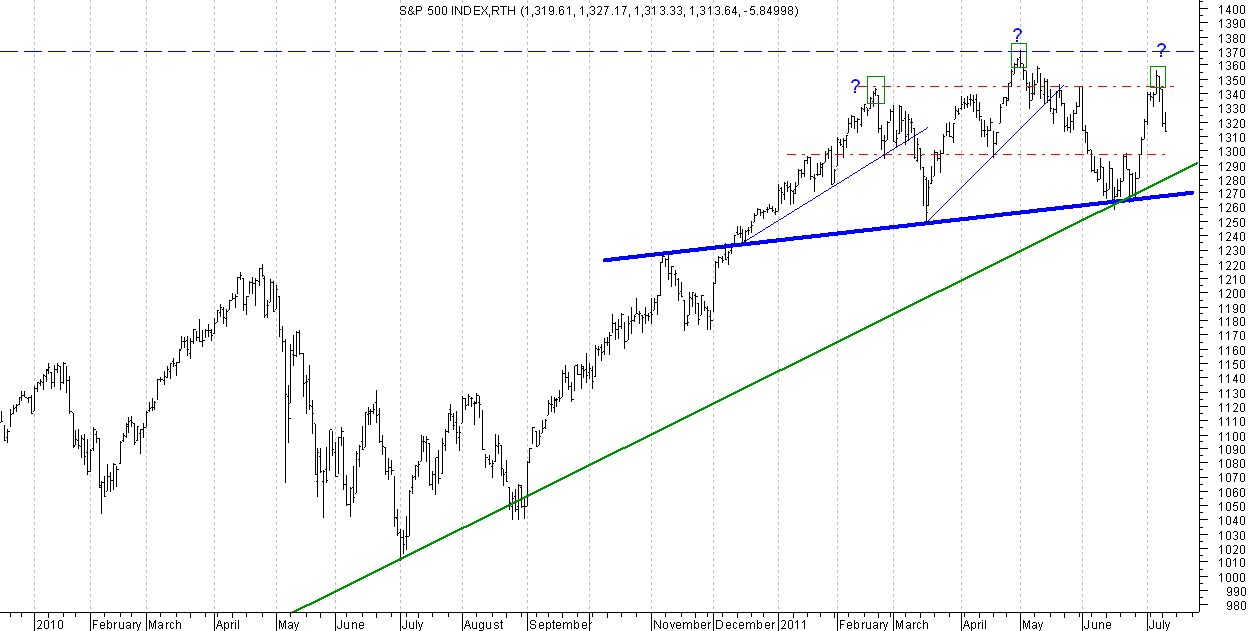
A sideway action, which looks unfavorable for bulls, so far, is hovering just below a major resistance zone. We don’t know yet if this pattern will turns to be a Head-and-Shoulders topping reversal pattern, but if so, it will reverses the 2009/ 2010 Bull Market. You must know that the trend will remain in force until the bears decisively penetrate the rising blue trend line, but in this commentary we want to identify important levels to watch and question the current structure extensively.
The rally, which initiated off late June swing low, found resistance, concentration of supply, just below the early May swing high (possible Head). The current decline may encounter a buying pressure near the horizontal support line @ 1,300, but any bounce shouldn’t be taken as a reason to be bullish on the market, because s long as the index lies below the structure key resistance zone (1,345/ 1,370), the odds will continue to be in the favor of a continuation of the current lateral action.
A decisive down-breakout below the “prospected” neckline (nearly below 1,270)- which will take place after penetrating a rising major green trend line- signals a completion of the pattern and indicates that sellers will dominate the markets for a long time to come.
Ramy Rashad, CMT
التعديل الأخير بواسطة المشرف:


